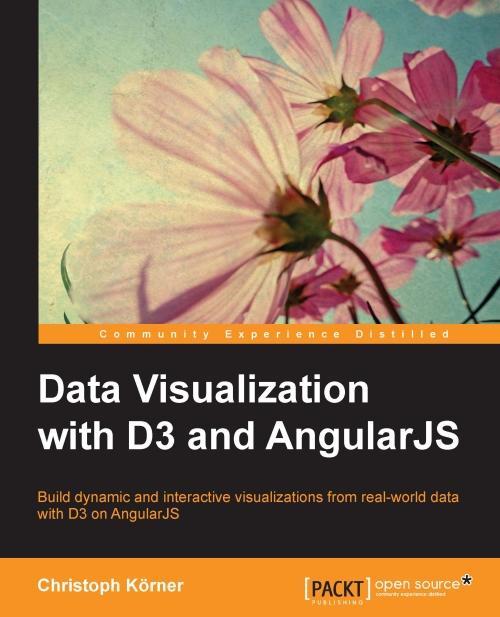
Autor: Christoph Körner
Broj strana: 278
ISBN broj: 9781784398484
Izdavač:
PACKT PUBLISHING ![]()
Godina izdanja: 2015.
 |
 |
 |
 |
 |
||||
If you are a web developer with experience in AngularJS and want to implement interactive visualizations using D3.js, this book is for you. Knowledge of SVG or D3.js will give you an edge to get the most out of this book.
Using D3.js, the powerful JavaScript toolkit for creating cross-platform vector graphics, you can now combine performance with maximum compatibility to build a web-based visualization and present data in an interactive and convenient way. We'll reach top-notch reusability and testability by combining D3 graphics with our favorite web application framework, AngularJS.
This book teaches the basics of vector graphics, D3, and AngularJS integration, and then dives into controlling, manipulating, and filtering data. You will learn about the testability of components and how to implement custom interactions, filters, and controllers; discover how to parse and map data in D3.js; and get a grasp on drawing D3.js built-in shapes and curves. After reading the last few chapters, you'll be able to bring life to your visualizations with more features of D3.js such as interactions, animations, and transitions. You will finish your journey by implementing a parser for different server application logs and display them on a Google Analytics style interactive dashboard.
Christoph Körner is the CTO of GESIM, a Swiss startup company, where he is responsible for its simulation software and web interface that is built using AngularJS and D3. He studied electrical engineering and information technology at Vienna University of Technology, including a 1-year exchange program at the Swiss Federal Institute of Technology, Lausanne.
Christoph is a passionate, self-taught software developer, coworker, and web enthusiast with more than 7 years of experience in designing, developing, and implementing customer-oriented web-based IT solutions. He has always been enthusiastic and curious about new technologies and started to use AngularJS and D3 since the very first version. Christoph is not only fascinated by technology, but he also aims to push cutting-edge technologies to production services.
Budite prvi koji će ostaviti komentar.

Popust cena:
2280.00 rsd

Popust cena:
1490.00 rsd
© Sva prava pridržana, Kompjuter biblioteka, Beograd, Obalskih radnika 4a, Telefon: +381 11 252 0 272 |
||